Table of Contents
Most B2B marketers track ad performance by staring at clicks and impressions, then wondering why their CFO keeps questioning the marketing budget. This guide covers what you actually need to track (hint: it’s revenue, not vanity metrics), how to connect your ad spend to real pipeline, and how to stop wasting time on manual reporting so you can focus on the strategy that actually matters.
Ad performance tracking is the process of measuring how well your digital ads are working. This means collecting data on who’s seeing your ads, who’s clicking them, and most importantly, whether those clicks are turning into actual customers and revenue.
Without tracking, you’re basically guessing. You might know you spent $50,000 last month on LinkedIn ads, but you have no idea if that money generated $5,000 or $500,000 in pipeline. Tracking connects your ad spend to real business outcomes so you can make smarter decisions about where to put your budget.
The goal isn’t just to collect data for the sake of it. It’s to figure out what’s working so you can do more of it, and what’s not working so you can stop wasting money on it.
Here’s the thing. Your CFO doesn’t care that your latest campaign got 10,000 impressions. They care whether your marketing budget is generating revenue or burning cash. In fact, 63% of marketing leaders report increased pressure from CFOs to prove marketing value.
Ad performance tracking is how you prove your value. It shows exactly which campaigns are bringing in qualified leads, creating pipeline, and closing deals. When budget cuts come around (and they always do), the marketers who can show a clear line from ad spend to revenue are the ones who keep their budgets. With 59% of CMOs reporting insufficient budget to execute their strategy in 2025, proving ROI has never been more critical.
Beyond job security, tracking makes you better at your job. You learn which audiences respond to your message, which channels deliver the best ROI, and which creative approaches actually resonate with buyers. Over time, this knowledge compounds, and you get smarter with every campaign you run.
Not all metrics deserve your attention. Some look impressive in a slide deck but tell you nothing about whether your ads are working.
The trick is knowing which numbers to ignore and which ones to obsess over.
These are the metrics that make you feel good but don’t connect to revenue. They’re useful for diagnosing specific problems, but they shouldn’t be your primary measure of success.
Here’s the problem with these metrics. They measure activity, not outcomes. You can have a campaign with a terrible CTR that generates millions in pipeline, and another with an amazing CTR that generates zero revenue. Guess which one your boss cares about.
These metrics connect your ad spend directly to money. They’re harder to track because they require integrating your ad platforms with your CRM, but they’re the only numbers that actually matter in B2B.
The difference between these two categories is simple. Vanity metrics tell you if people saw your ad. Business metrics tell you if your ad made you money.
| Metric type | What it measures | Why it matters (or doesn’t) |
|---|---|---|
| Vanity metrics | Top-of-funnel engagement like impressions and clicks | Looks good in reports but doesn’t prove ROI. Use for troubleshooting only. |
| Business metrics | Pipeline, revenue, and acquisition costs | Directly shows whether your ad spend is profitable and worth continuing. |
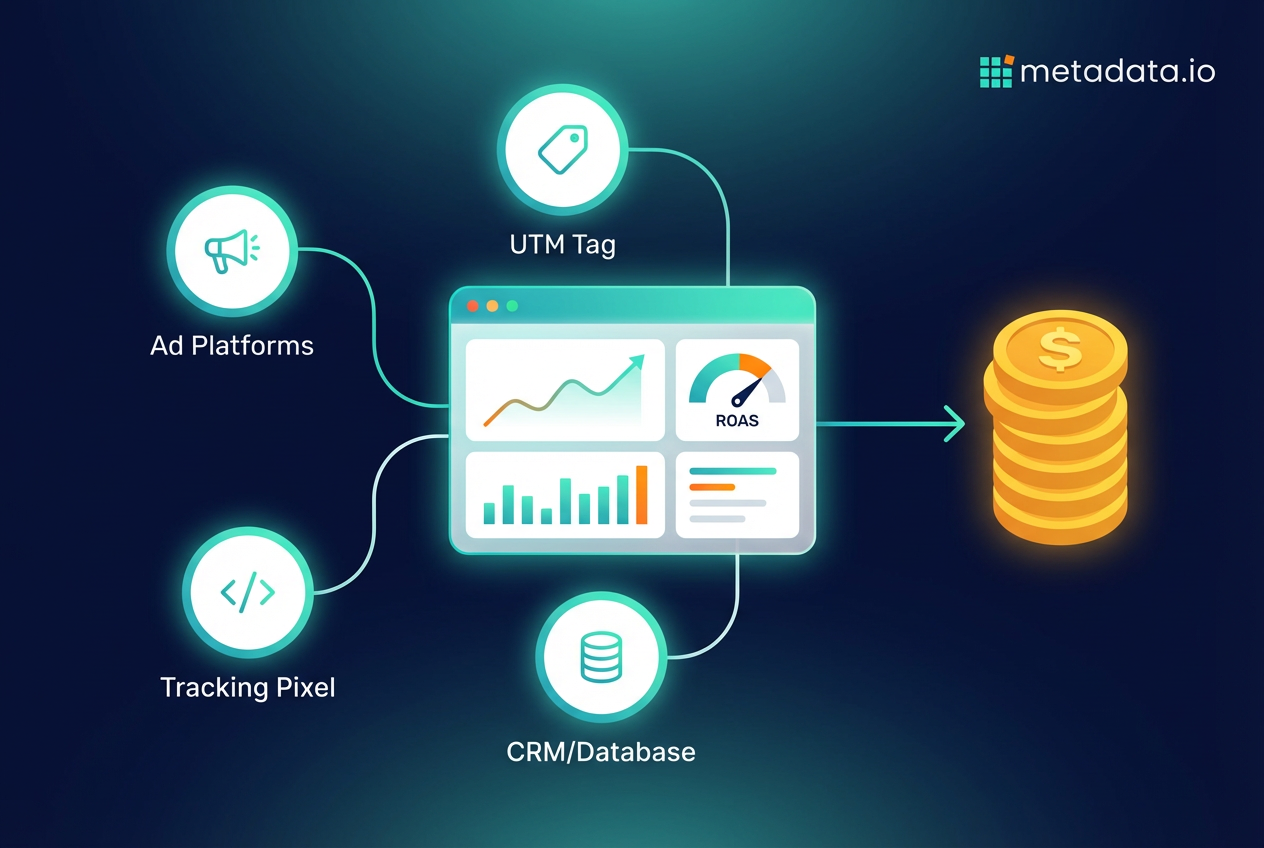
Tracking isn’t one thing. It’s a combination of different methods working together to give you a complete picture of what’s happening with your campaigns.
Here are the main approaches you’ll use.
UTM parameters are tags you add to the end of your URLs. They tell your analytics platform exactly where each visitor came from—which campaign, which ad, even which specific creative variation.
A URL with UTM parameters looks like this:
www.yoursite.com?utm_source=linkedin&utm_medium=cpc&utm_campaign=q4-demand-gen
When someone clicks that link, your analytics tool knows they came from a paid LinkedIn ad in your Q4 demand gen campaign. Without UTMs, all your traffic just shows up as “linkedin.com” with no context about which specific campaign drove it.
The key is being consistent with your naming conventions. If you use “linkedin” in one campaign and “LinkedIn” in another, your analytics will treat them as separate sources and your data will be a mess.
A tracking pixel is a tiny piece of code you put on your website. When someone visits a page or completes an action like filling out a form, the pixel sends that information back to the ad platform.
This is how LinkedIn knows that someone who clicked your ad three days ago just downloaded your whitepaper. It’s also how platforms build retargeting audiences and optimize their algorithms to find more people like the ones who are converting.
Most ad platforms require you to install their pixel if you want accurate conversion tracking. Without it, you’re flying blind.
This is where B2B tracking gets real. Integrating your ad platforms with your CRM connects your ad spend to actual business outcomes like qualified leads, opportunities, and closed deals.
Here’s why this matters. Your ad platform might tell you that a campaign generated 100 leads. But without CRM integration, you have no idea if those leads were interns at tiny companies or VPs at enterprise accounts in your target market. CRM integration tells you which campaigns are generating the leads that actually turn into revenue.
This is also how you track metrics like pipeline generated and customer acquisition cost. The ad platforms can’t see that far down your funnel on their own.
An ad tracking platform pulls data from all your different ad channels and your CRM into one place. Instead of logging into LinkedIn, Google, Meta, and Salesforce separately to piece together what’s happening, you get a single dashboard showing performance across everything.
The best platforms go beyond just reporting. They use the data to automatically shift budget toward the campaigns and channels that are actually generating pipeline, and away from the ones that aren’t. This means your budget is always working toward your real goals, not just vanity metrics like clicks.
Tracking ad performance in B2B is harder than in B2C. You’re not selling a $30 product with a five-minute purchase decision. You’re dealing with six-figure deals, six-month sales cycles, and buying committees with five different stakeholders.
This creates some unique problems.
Long sales cycles make attribution messy. Someone might click your ad in January, download a whitepaper in March, attend a webinar in May, and finally request a demo in July. With 74.6% of B2B sales to new customers taking at least 4 months to close, attribution becomes increasingly complex. Most attribution models only look back 30 days, so they’ll give all the credit to whatever happened right before the demo request. But that first ad in January might have been what started the whole relationship.
Multiple people are involved in every deal. A single purchase decision might involve an end user who saw your LinkedIn ad, a manager who read your blog post, an IT director who attended your webinar, and a CFO who never interacted with your marketing at all. According to Gartner research, buying committees typically consist of six to ten decision-makers. Connecting all these different touchpoints to a single account’s journey is complicated.
Your data lives in different places. Ad performance data is in Google Ads and LinkedIn Campaign Manager. Lead data is in your CRM. Website behavior is in Google Analytics. Stitching this all together manually means hours of spreadsheet work every week just to understand what’s happening.
The companies that solve these problems are the ones that can actually prove their marketing ROI. The ones that don’t are stuck arguing about whether a 2% CTR is good or bad.
Collecting data is pointless if you don’t use it to make better decisions. Here’s what you should actually do with your tracking data.
Your data shows you which audiences are responding to your ads and which ones are turning into pipeline. If ads targeting “Directors of Marketing” are generating opportunities while ads targeting “Marketing Managers” are going nowhere, you know where to put your budget.
The key is testing specific audience segments against each other. Try different job titles, company sizes, industries, and intent signals. Then double down on the segments that are actually converting into revenue, not just clicks.
Look at which ad variations are driving results. Is it the ad with the customer quote or the product screenshot? The message about saving time or saving money? The casual tone or the professional one?
Kill the underperformers and create new variations based on what’s working. If your data shows that ads mentioning “pipeline generation” outperform ads about “lead generation,” that’s a clear signal about what language resonates with your audience.
Performance data tells you where to allocate your money. If LinkedIn campaigns are generating qualified leads at $200 each while Google Search campaigns are costing $400 per lead, shift more budget to LinkedIn.
Within a single platform, give more budget to the campaigns and ad sets that are hitting your pipeline goals. This sounds obvious, but most marketers just split their budget evenly across campaigns and hope for the best.
Ad tracking doesn’t stop at the click. If an ad has a great CTR but the landing page has a terrible conversion rate, the problem isn’t the ad. It’s what happens after the click.
Use your tracking data to identify which landing pages are converting and which ones are losing people. Then test different headlines, form lengths, and calls-to-action to improve the pages that are underperforming.
Look, the goal isn’t to become a data analyst. It’s to generate revenue from your ad spend.
But here’s the reality. Manually pulling reports from five different platforms, connecting the dots between clicks and closed deals, and making daily budget adjustments across dozens of campaigns is a full-time job. It leaves zero time for the strategic work that actually moves the needle.
What if you could set your revenue goals and have a system automatically figure out the best combination of audience, creative, and channel to hit them? That’s the difference between tracking performance and actually driving it.
When you automate the tedious work of monitoring and optimization, you can focus on strategy. You can test bigger ideas. You can finally prove that your marketing budget is generating real revenue, not just activity.
That’s what modern ad performance tracking looks like. Not spreadsheets and manual reports, but systems that turn your ad spend directly into pipeline while you focus on the work that actually requires a human brain.
Frequently Asked Questions (FAQ)
What's the difference between ad tracking software and analytics platforms?
How long does it take to see accurate ad performance data?
Can you track ad performance without a CRM?
What's the best attribution model for B2B ad tracking?
How much should you spend on ad tracking tools?
Do you need different tracking for LinkedIn versus Google ads?


