February 2021 – Product Updates
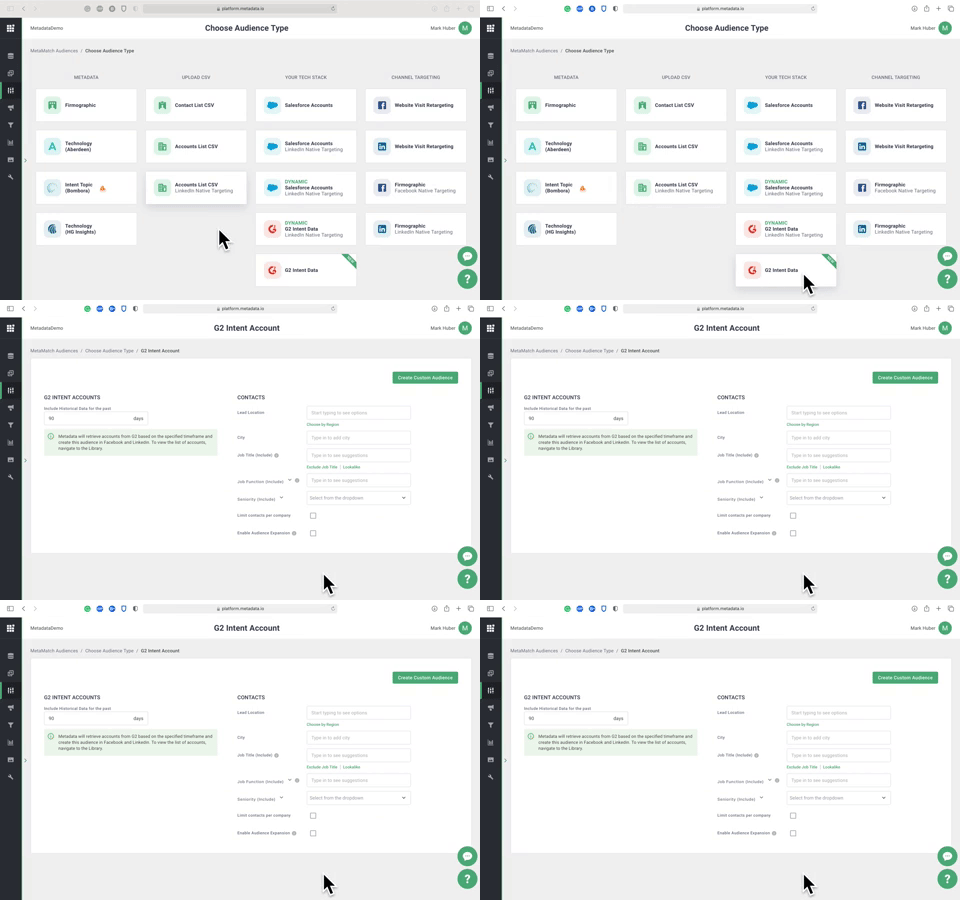
Target your audience on Facebook and LinkedIn with G2 Buyer Intent
We recently announced our new LinkedIn integration with G2. And we’re even more excited to roll this out on Facebook for you.
With this latest release – you can now create static contact lists from accounts that have visited your profile page on G2 and use this audience for your Facebook campaigns.
We’ll be releasing a dynamic Facebook audience soon so you can forget about maintaining static lists and get off the .CSV hamster wheel.
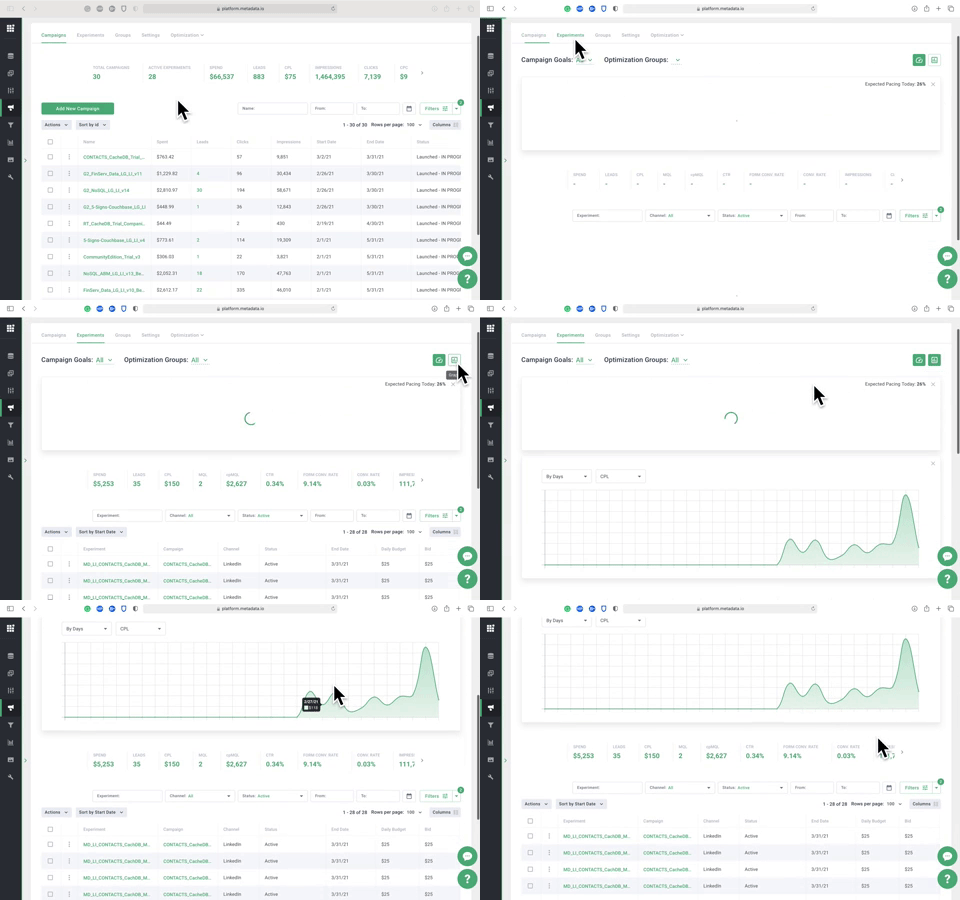
Use graphs to see how your experiments perform over time
To help your reporting – we’ve added a new way to for you to visualize how you’re experiments are performing over time.
You can now view the trends for metrics like Clicks, Impressions, Leads and MQLs from each of your experiments. Plus cost and spend metrics too.
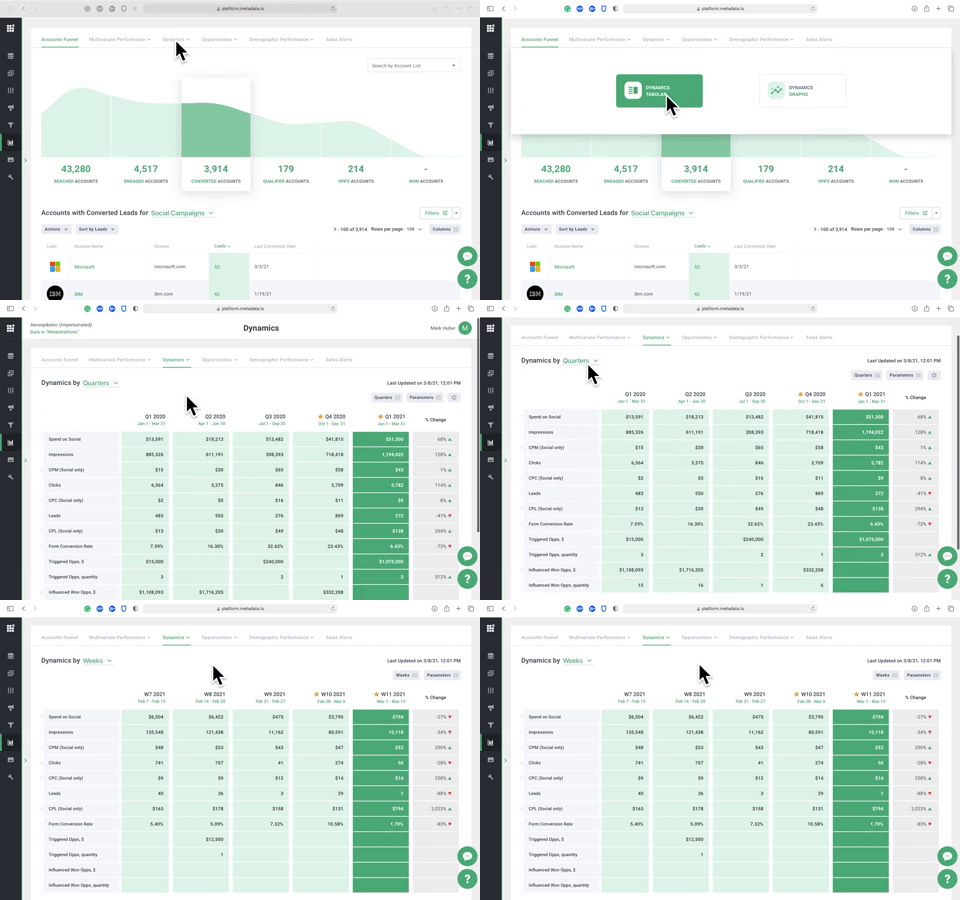
View weekly trends for your KPIs and performance metrics
Point-in-time reporting can only show you show much. We’re excited to release this new reporting improvement so you can track weekly trends of your KPIs and performance metrics over time in an easy table format.
By default, we show the last 12 weeks in the table report. You can choose which weeks you want to include in the table in the “Weeks settings”.
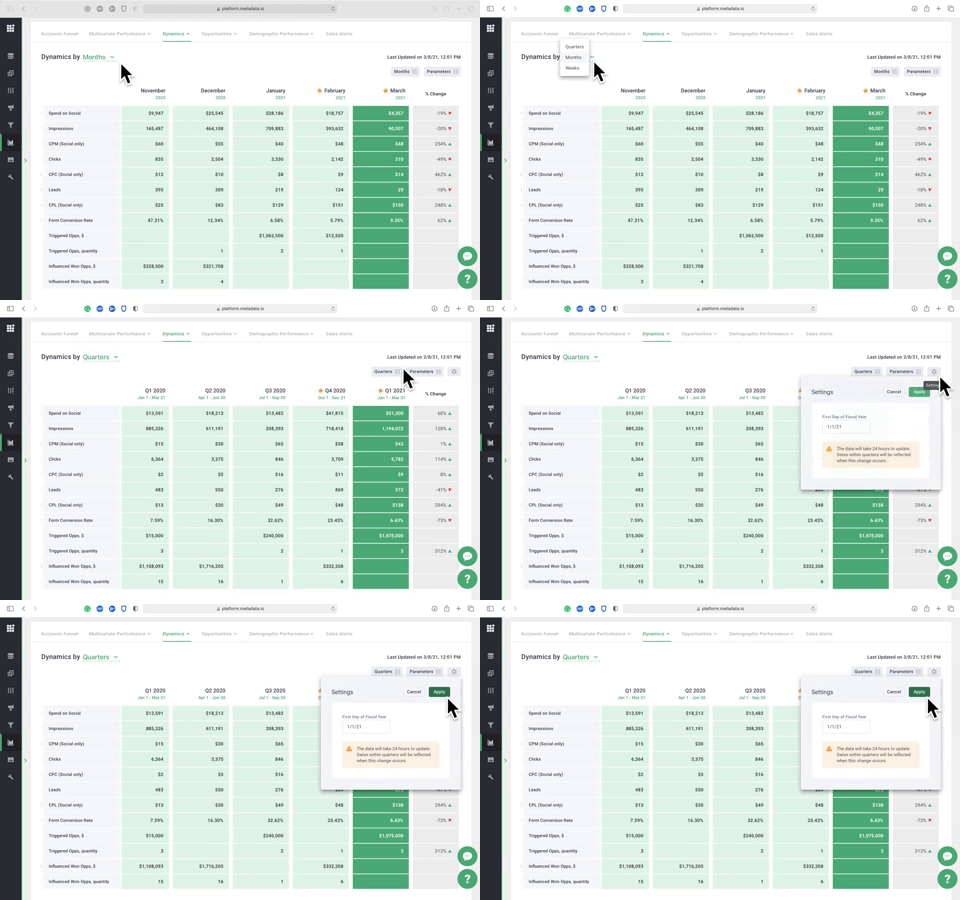
Set fiscal year for your annual and quarterly reports
Sometimes the calendar and your fiscal calendar don’t always match up (we’re guilty of this too at Metadata). Now you can set the first date of the fiscal year for your company and have this reflected in your Metadata reports.
To customize this, click the setting icon on the Dynamics by Quarters report, and enter the first date of the fiscal year.
It takes up to 24 hours for this change to be reflected in your reports.
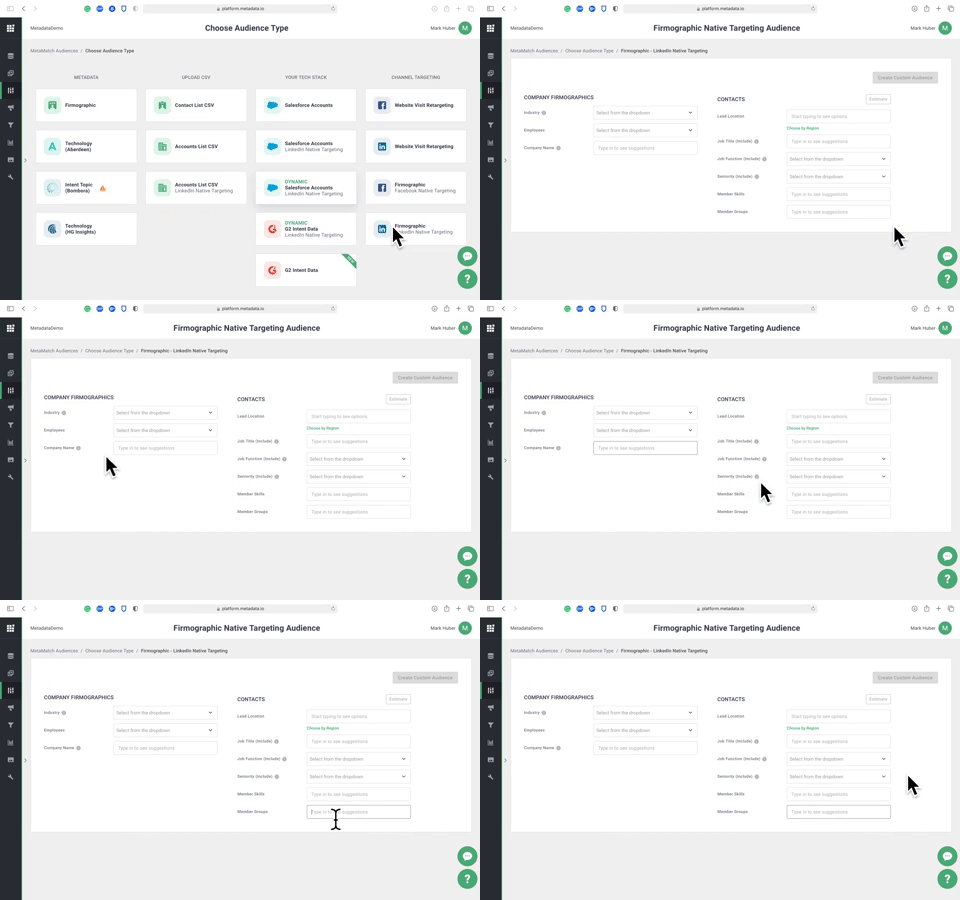
Target your audience natively on LinkedIn by company name and member groups
We added two new filters for you to target your audience natively on LinkedIn:
– Member Groups – this means you can find relevant member groups your audience belongs to and use this as way to target them
– Company Name – this means you can be confident you’re targeting the right companies by selecting the company name associated with their company LinkedIn profile
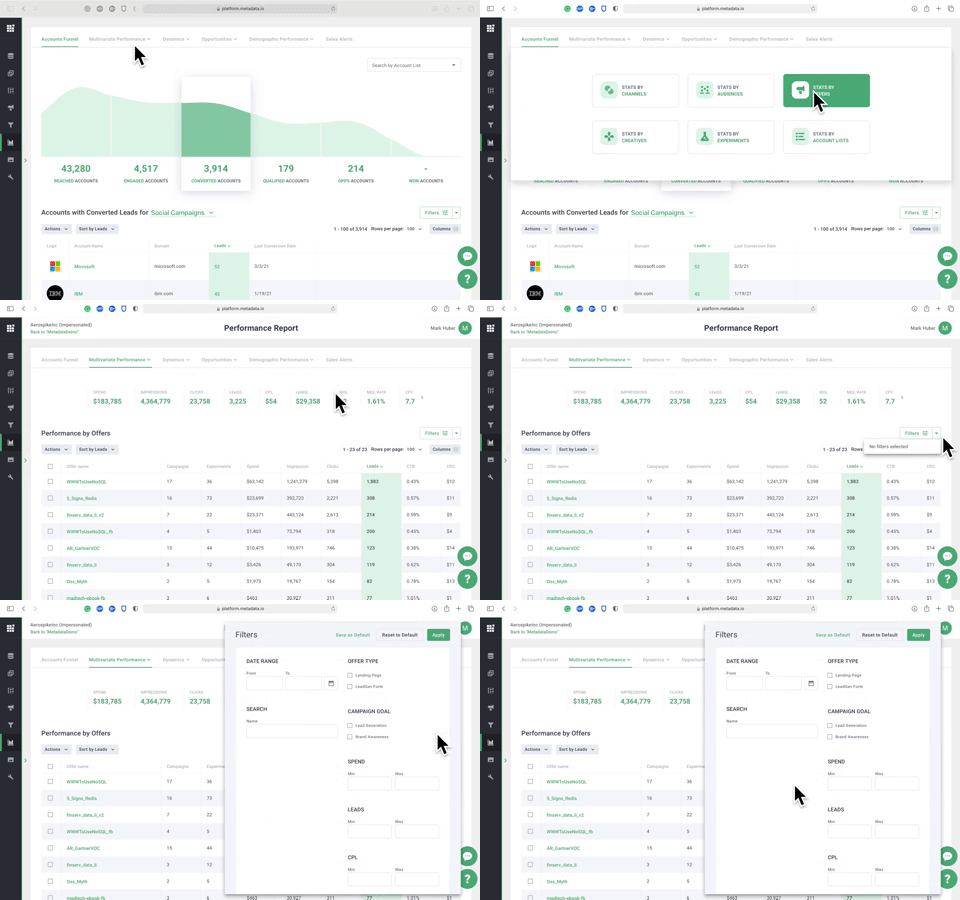
Get more granular reporting for your campaign offers
You now have a few more filters available in your Performance by Offers report. This means you can include (or exclude) offers in your reports based on total spend, number of leads generated and Cost-per-Lead.
You now also have the ability to export your performance data in a .CSV format so you can slice and dice it even further in your reporting tool of choice.
