Table of Contents
So you’re up to speed on the difference between ABM and demand gen tactics, you’ve launched a couple of campaigns, and leads are starting to trickle in.
Now you have to face the more difficult question to answer: how do you measure account-based marketing success?
Be careful when answering this one—in many ways, we’ve been brainwashed by traditional ABM vendors when it comes to measuring the success of ABM campaigns.
They recommend measuring what their platforms were built to measure… not the metrics that matter to you, your boss, and your boss’s boss.
According to 91% of companies, adopting an ABM approach significantly increased their chances of converting deals from pipeline to closure compared to using a non-ABM strategy. These results stem from carefully measured and optimized ABM programs that focus on key metrics.
Traditional ABM programs and platforms will point to things like reach, engagement, and influenced pipeline as key performance indicators —three key metrics I would never hang my hat on.
Your reach doesn’t matter if you’re not reaching the right people, engagement doesn’t always result in pipeline, and influenced revenue is fuzzy math at best.
“Influenced revenue’ is a loose metric, defined differently by every ABM platform.
The calculations tend to be generous, giving marketers way too much credit for the impact their marketing programs generate. Some platforms will give you “influenced” credit for a deal based on serving a single ad impression.
But that’s not the worst part.
What’s even more dangerous is that influenced revenue has the habit of getting marketers laser-focused on the easiest-to-measure channels instead of the highest-impact channels.
And most sales teams want their marketing teams focused on sourcing new deals, not running tactics that just help them claim attribution on revenue that would inevitably close anyway.
On this episode of By Marketers for Marketers, Jason Widup, VP of Marketing at metadata.io, and Mark Huber, Metadata’s Director of Growth, discuss how to successfully measure ABM.
If you’re just testing the ABM waters, you’ll quickly realize Salesforce and marketing automation platforms weren’t originally set up for an account-based marketing approach.
They were set up to manage and track individual people as buyers.
A quick caveat with that in mind: rather than rebuilding your systems or buying other expensive tools to do this for you, just keep it simple with your measurement.
You can get away just fine by using many of the same metrics for both your ABM and demand gen campaigns.
You can use demand gen to:
You can use ABM to:
Less is more, here.
Marketers tend to overcomplicate measurement, getting caught in analysis paralysis instead of executing.
Instead of spending a bunch of time setting up measurement systems to measure things that may or not matter, first determine what you want to measure (and why). Then obsess over the analysis.
Pro tip: include metrics your CEO and CFO will actually understand; e.g. those clearly tied to business outcomes.
By focusing on account-specific outcomes and long-term relationships, ABM measurement provides a more accurate picture of marketing’s impact on revenue. This shift enables organizations to optimize their strategies for maximum revenue impact, ensuring that marketing efforts directly contribute to business growth.
When measuring Account-Based Marketing success, three foundational metrics provide a comprehensive view of your program’s effectiveness. Originally developed by growth consultancy ITSMA, the “Three Rs” framework—Reputation, Relationships, and Revenue—creates a dynamic system where each element reinforces the others.
Your reputation in the eyes of target accounts goes beyond mere brand awareness. It’s about establishing credibility and trust with specific decision-makers who matter most to your business.
Key metrics to track reputation include:
The relationship component focuses on building meaningful connections with multiple stakeholders within target accounts.
Essential relationship metrics include:
Revenue serves as the ultimate validation of your ABM efforts, influenced by the strength of your reputation and relationships.
Critical revenue metrics to monitor:
By tracking these foundational metrics together rather than in isolation, you can better understand the full impact of your ABM program and make more informed decisions about resource allocation and strategy refinement.
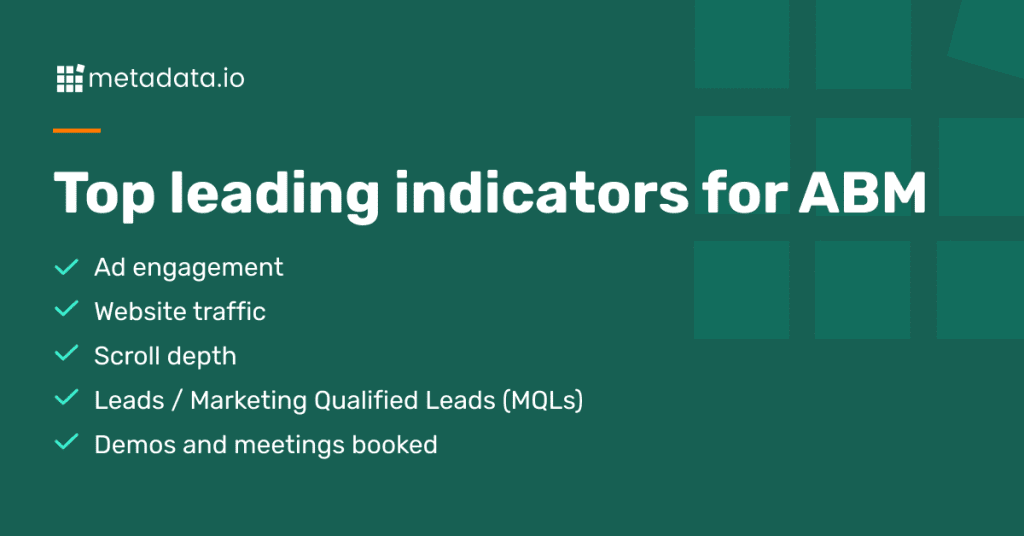
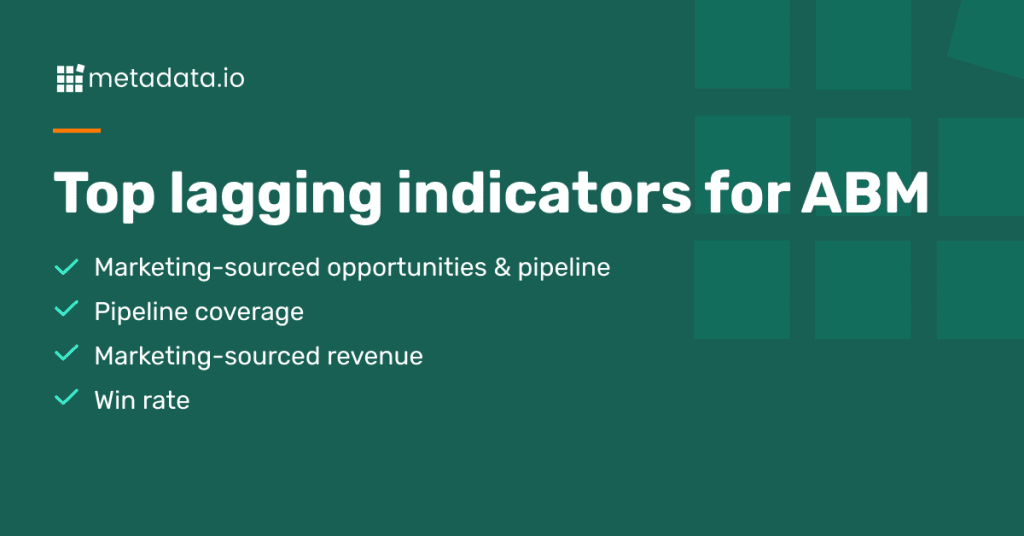
We try to keep this simple approach when measuring our ABM efforts here at Metadata: in general, we keep our ABM metrics to five leading indicators and four or five lagging indicators (depending on how you look at it).
Leading indicators are forward-looking metrics that help forecast future outcomes, while lagging indicators measure past performance and actual results. By analyzing both types of indicators together, you can make data-driven decisions about resource allocation, predict future revenue more accurately, and identify areas for optimization before they impact results.
These metrics together give us everything we need to understand both how our ads are performing and their impact on revenue.
Let’s walk through all nine of them.
First up: how your audience is (or isn’t) engaging with your ads, whether it’s a conversation ad on LinkedIn or a PPC ad on Google.
Why? Because it all starts with the first impression. If your ad isn’t being served to the right person and list of accounts, everything else will suffer. If your copy or creative is lacking, you’ll see low engagement and subsequently lower conversions.
This is less of a vanity metric and more of an in-the-weeds question: are my ads good enough to meet our long-term goals, or should we revisit our approach?
To measure ad engagement, we recommend looking at both quantitative and qualitative metrics.
In general, you’re looking to keep your CTR as high as possible and your marketing costs (CPM and CPC) as low as possible, so you can reach as many individuals within your list of accounts as possible.
Implementing an account engagement scoring system can further enhance this metric. By assigning values to specific interactions and weighting them according to importance, you can prioritize accounts based on their level of interest and interaction. This helps predict which accounts are most likely to convert and allows for more focused resource allocation.
Not every single ad campaign should be aimed at sending traffic to your website; that’s not how marketing works anymore. Many people will want to stay wherever they are (their inbox, LinkedIn, Facebook, and so on).
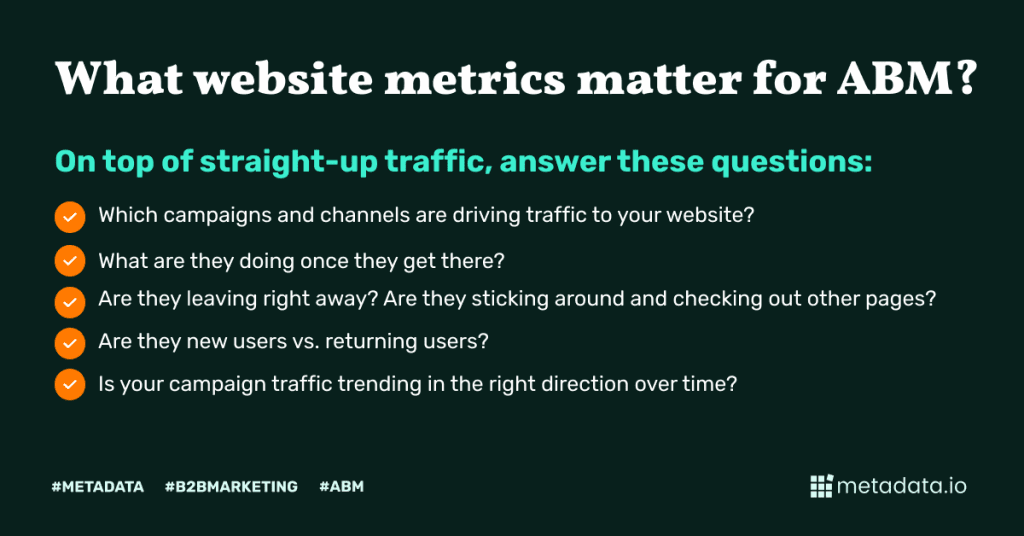
Website traffic is still an important leading indicator for assessing how effective your ads are at driving the right traffic to your site (i.e. are they likely to convert or are you wasting clicks)?
Measuring website traffic is fairly straightforward, as long as you’re consistently using the same UTM parameters (so make sure to find a format and stick to it).
On top of straight-up traffic, look for answers to questions like:
Go deeper than website traffic metrics by looking at how engaged leads are once they land on your website. If people click on your ads and land on your site, you want to make sure they’re actually consuming your message and your content.
Think about the last time you clicked on an ad out of curiosity, spent 5 seconds on the landing page, and then left.
This is natural behavior, especially if you’re pulling folks from Facebook or LinkedIn. But you’re ideally looking for conversions that lead people to stay (qualified traffic, in other words).
Instead of looking at bounce rate (which might lead you to sound the alarm too early), we recommend looking at how deep visitors are scrolling on your site. You can measure scroll depth in Google Analytics with some light set up in Google Tag Manager. (Check out this article to learn how to set this up.)
I typically measure scroll depth in 25% increments (i.e. 25%, 50%, 75%, and 100%).
Big picture, you’re trying to answer this question: after people click on your ad and arrive on your landing page, how much of the page are they consuming? If they’re only looking at 25% of your page (or even 50%), you’ll want to reassess how consistent your messaging is between your ad and your landing page.
Looking at scroll depth as a leading indicator helps you avoid a bait and switch kind of situation and keep your messaging aligned.
We’re not here to argue whether or not MQLs are dead. Why? Because all that really matters is:
1. How well defined each metric is for your own company
2. Whether your sales team is on the same page with the definition, and
3. You know these aren’t the metrics you hang your hat on.
(Full disclosure: We don’t care about leads or MQLs very much at Metadata, but that’s because of our ungated approach to content and where we’re at with measurement maturity. If you’re still gating your content, you’ll want to keep track of both metrics.)
Read More: How Not to Lose Your Marketing Budget for 2021
We recommend looking at these ABM metrics at both the campaign and channel level.
As you get this measurement set up, start asking questions like:
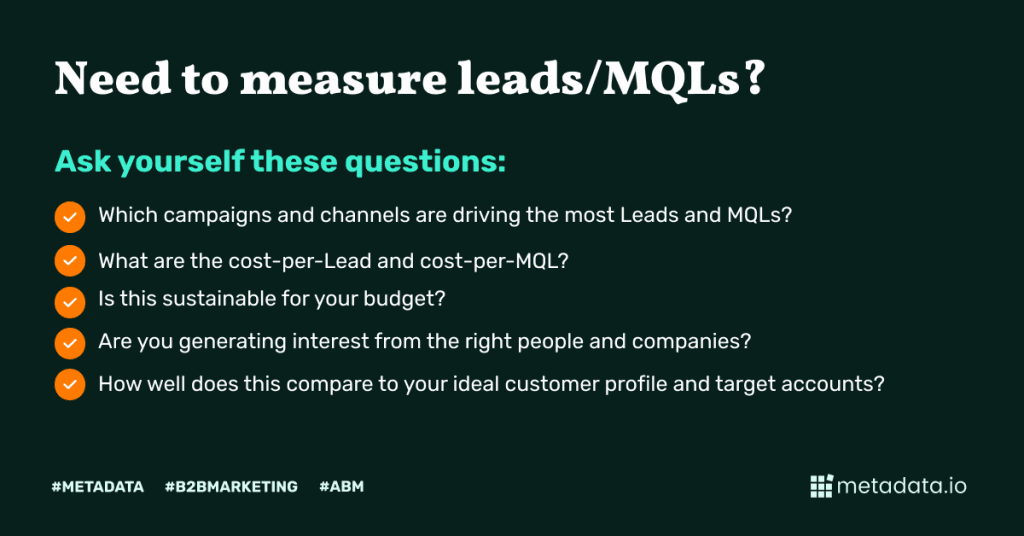
If you’re generating interest from the wrong people, it’s time to look at your targeting and your content to see what’s missing the mark.
Exactly how you measure this will depend on whether you’re marketing software versus services; but, at the end of the day, your marketing needs to be generating high-intent leads.
Demos and meetings booked are the best way to measure that interest.
The key here is to make sure you’re generating interest from the right people—not just anyone, but the people in your ideal customer profile and target account list.
For starters, you’ll want to determine how many demos and meetings booked you need each month and each quarter.
At Metadata, we look at this on a weekly and monthly level as a gut check, but we don’t obsess over it—it’s just to make sure we’re on the right track. (It’s still a leading indicator, remember?)
You’re looking for a few things when you measure demos and meetings booked:
If you aren’t on the hook for generating qualified pipeline for your sales team, you’ve got a pretty cushy, low-pressure gig.
The reality is, in order to meet your company’s revenue targets, you’ll need to make sure you’re generating enough qualified pipeline each month to stay on track. That’s where both marketing-sourced opportunities and pipeline metrics come in.
Read More: How to Build a Demand Model Any CMO Would Respect
These are just two different ways to slice the same pie: marketing-sourced opportunities look at individual potential deals, while marketing-sourced pipeline looks at the entire lift across a month or quarter.
To measure either, don’t obsess over attribution—there’s no such thing as perfect attribution.
At Metadata, we use first-touch attribution to track marketing-sourced opportunities (and pipeline in general).
We use Hubspot workflows to populate two fields (Lead Source and Lead Source Detail), each of which have both marketing-owned and sales-owned values. Just make sure you’re aligned with your sales team on your targets for each measurement period.
Questions you can answer with these lagging metrics:
Pipeline coverage is just a fancy term that wants to answer a simple question: do we have enough pipeline?
It’s a ratio number: your total pipeline divided by your sales target (usually for each quarter).
If your sales target is $10M and your total pipeline is $40M, your pipeline coverage ratio is 4x. You’ll have to use historical data to assess whether that’s enough pipeline for how well your opportunities turn to closed/won.
If you’re looking at your pipeline coverage in the current quarter, you should only look at the total amount of open pipeline expected to close this quarter and your sales target for the same quarter (apples to apples and all that).
The standard measure of success is 3x pipeline coverage, but you can move the target each quarter: how is your pipeline coverage quarter over quarter? Are you looking good for next quarter, or is it time to start freaking out?
Either way, get ahead of this so you know when you need all hands on deck to generate short-term pipeline.
Pipeline velocity is another critical metric, measuring how quickly opportunities move through your sales pipeline. The formula for calculating pipeline velocity is:
Pipeline Velocity = (Number of Deals × Average Deal Value) / Average Sales Cycle Length
To optimize your pipeline velocity, focus on identifying and removing bottlenecks in specific sales stages, providing additional training to your sales team when slowdowns are detected, and adjusting your strategy to address common objections that slow down the process.
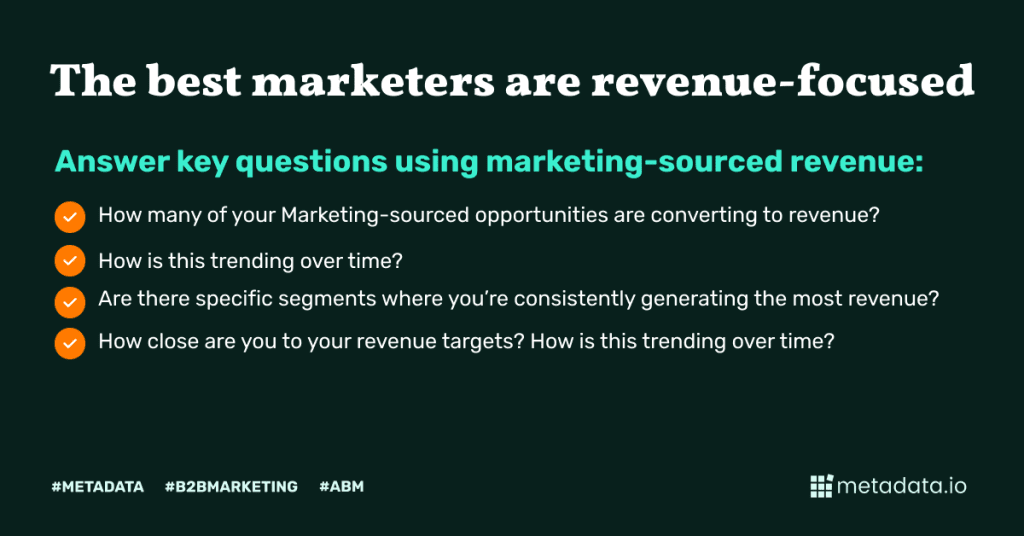
Marketing-source revenue might be “trendy” right now, but we’re not complaining: the best marketers are revenue-focused, and the best leaders hold their marketers accountable to revenue targets.
The mechanics of tracking marketing-sourced revenue is similar to marketing-sourced pipeline: you can use the same fields to track the amount of net-new-business revenue marketing is generating each month, quarter, and year.
Just remember: set your marketing-sourced revenue goals with your sales cycle length in mind.
You can answer key questions using this metric:
Calculating ROI and attributing revenue to ABM initiatives requires a methodical approach that goes beyond traditional marketing metrics. The fundamental formula for calculating ABM ROI is:
ROI = (Net Profit / Cost of Investment) × 100
For example, if you invest $50,000 in an ABM campaign that generates $200,000 in new revenue, your ROI calculation would be:
ROI = ($200,000 – $50,000) / $50,000 × 100 = 300%
To get a complete picture of ROI, you should also track Customer Acquisition Cost (CAC) and Customer Lifetime Value (CLV).
Win rate might not quite be your North Star metric, but you 100% need to be tracking this.
Companies use win rate to determine which time periods, sales reps, and win/loss reasons produce the strongest likelihood that a prospect will become a potential customer for the business.
In other words, it’s not just about quarter-over-quarter growth; it’s about improving over time.
Calculating win rate is straightforward: it’s the number of closed/won deals divided by the total number of deals in the pipeline.
Consider calculating win rate by month, quarter, and year to track progress over time. You should also specify which one is the “norm” so your entire org can follow along with the progress.
Looking at your win rate gives you the chance to draw qualitative conclusions from initially quantitative insights. You can answer questions like:
If you want to level up your measurement, you can measure things like:
If you’re generating opportunities and the ACV remains much lower than your sales team, you’re not generating the right opportunities. Ideally, you want ACV to be as close as possible whether it’s marketing-sourced or sales-sourced. Tie it to the big picture instead of getting bogged down: we recommend looking at the ACV for any marketing-sourced opps by quarter and by year. This may differ from your customer lifetime value (CLTV).
If your marketing is working well, you should be generating deals that move (and close) fast. Be sure to factor in the baseline B2B sales cycle when beginning to view these trends.
When your buyers come inbound as a result of your marketing, a lot of their questions and objections will have been addressed by the time they have their first meeting with your sales team. Track when lead activity takes place in your CRM; things like Demo Requested to Demo Scheduled and Demo Completed to Opportunity Created.
Again, take the long view here: are your deals and sales velocity speeding up or slowing down over the course of the year?
Qualitative feedback from the “dark funnel”
If you’re only doing marketing that can be measured quantitatively, there’s a good chance you’re focused on the wrong tactics, channels or behaviors.
Buyers are researching and evaluating in places that companies can’t track directly:
Should I go on?
But just because you can’t measure them with a tool doesn’t mean you shouldn’t invest in these channels and work on getting qualitative feedback from community members, social connections, customers, and more.
Your framework needs to account for longer B2B sales cycles and focus on business impact across the entire funnel.
Start by structuring your framework around these key steps:
To optimize your framework’s effectiveness:
Successful measurement isn’t just about tracking numbers—it’s about gaining insights that drive program improvements. Your framework should be flexible enough to evolve as your ABM program matures, while maintaining focus on the core metrics that matter most to your business objectives.
The evidence is clear: Account-Based Marketing drives exceptional results when properly executed and measured.
However, success demands more than just implementation—it requires continuous measurement, analysis, and refinement. The most effective ABM programs consistently monitor key metrics across relationship development, journey progression, and revenue impact, using these insights to optimize their strategies in real-time.
Start by implementing a comprehensive measurement framework today, and use those insights to drive ongoing improvements in your ABM strategy. Your future revenue growth depends on the actions you take now to optimize your approach. Transform your marketing strategy with Metadata.io — drive more leads, optimize campaigns, and scale your results effortlessly. Book an intro today!