Table of Contents
Most B2B marketers are drowning in ad metrics that don’t matter while the numbers that actually connect to revenue get ignored. This guide breaks down which ad performance metrics you should track, how to improve them without burning out on manual work, and why most teams are wasting 70% of their time on spreadsheets instead of strategy.
Ad performance is how you measure whether your ads are actually working. This means tracking specific numbers that show if people are clicking, converting, or buying after they see your ads.
For B2B marketers, “working” has a very specific definition. It’s not about vanity metrics like impressions or likes. It’s about finding the right people at the right companies and turning them into paying customers. Ad performance connects every dollar you spend on ads directly to business results.
Think of it this way: if you spend $10,000 on LinkedIn ads this month, ad performance tells you exactly what you got for that money. Did you generate 50 qualified leads? Did those leads turn into $100,000 in pipeline? That’s what matters.
You can track hundreds of different ad metrics. Most of them are completely useless. The trick is knowing which numbers actually tell you something about your business and which ones just make pretty charts.
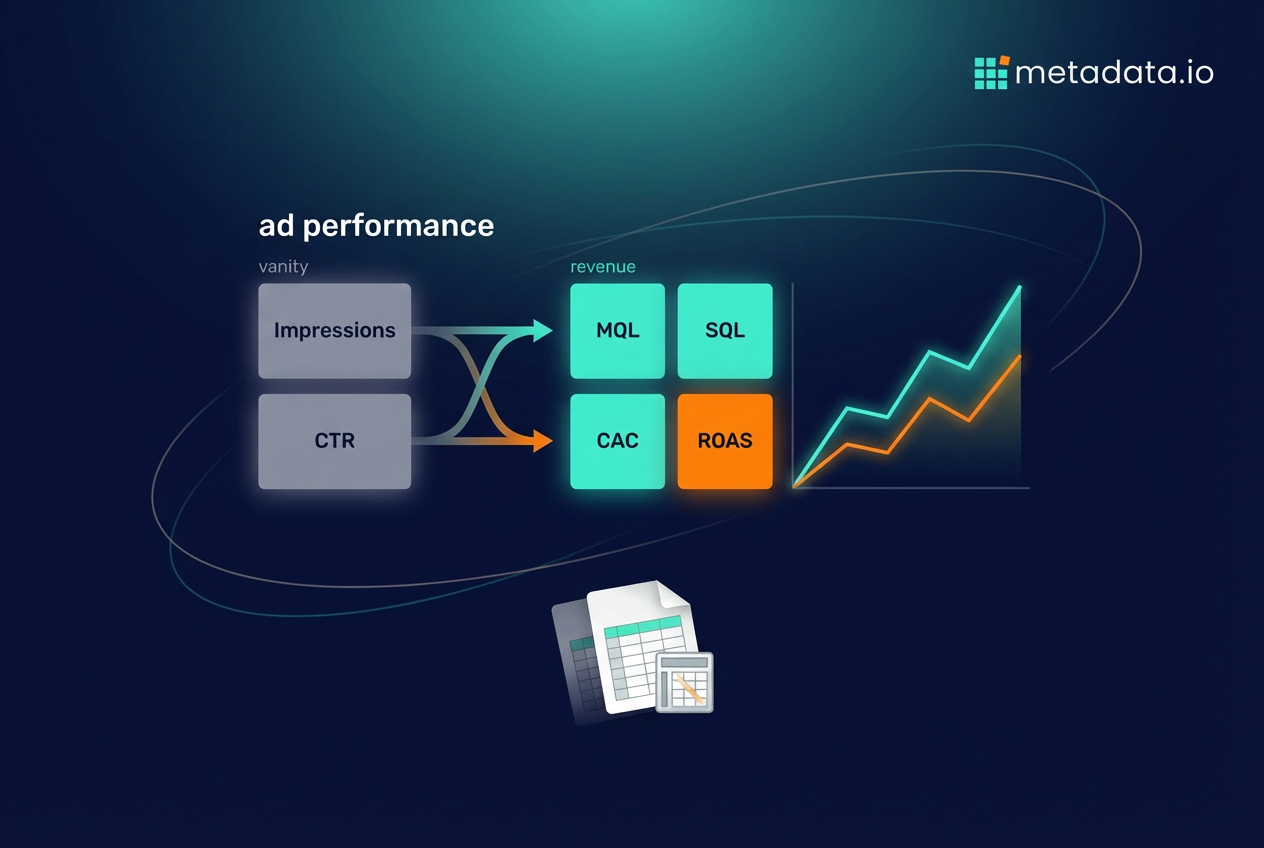
Let’s break this down into three categories: vanity metrics, pipeline metrics, and revenue metrics. You need to understand the first category so you can mostly ignore it and focus hard on the other two.
These are the numbers that look impressive in a board deck but don’t tell you anything about whether your ads are making money. They’re easy to measure and even easier to get distracted by.
Impressions are the number of times your ad showed up on someone’s screen. This tells you people might have seen your ad, but it doesn’t tell you if they cared. You could have a million impressions and zero customers.
Clicks count how many times someone clicked your ad. Better than impressions, sure. But a click isn’t a customer, and it definitely isn’t revenue.
Click-through rate (CTR) is the percentage of people who clicked after seeing your ad. A high CTR might mean your ad copy is compelling. Or it might just mean you wrote clickbait that attracts tire-kickers.
Now we’re getting somewhere. Pipeline metrics track how your ads are building a list of actual potential customers. These numbers measure real intent and qualification, not just casual interest.
Sales qualified leads (SQLs) are MQLs that your sales team has accepted and is actively trying to close. This is huge because it means marketing is handing off opportunities that sales actually wants to work.
Pipeline generated shows how many opportunities you’re generating from your ad budget. This is a leading indicator of a healthy strategy or identifies where the engine needs improvement.
Qualified Pipeline measures the opportunity quality you’re driving. Increasing Pipeline to Qualified Pipeline conversion rates (and decreasing the cost of each qualified opportunity) has substantial impact on Revenue.
These are the only metrics your CFO and CEO really care about. They tie your ad spend directly to money coming into the business.
Customer acquisition cost (CAC) is the total cost of sales and marketing divided by the number of new customers you acquired. Your entire job as a marketer is to get this number as low as possible while maintaining quality.
Return on ad spend (ROAS) measures how much revenue you generate for every dollar spent on ads. If your ROAS is 3x, you’re making $3 for every $1 you spend. Anything below 1x means you’re losing money.
Pipeline-to-spend ratio shows how much qualified pipeline you’re generating from your ad budget. This is a leading indicator of future revenue and tells you if your demand generation engine is healthy or broken.
| Metric Type | Examples | What It Actually Tells You |
|---|---|---|
| Vanity | Clicks, Impressions, CTR | People saw your ad (maybe) |
| Pipeline | SQLs, Pipeline, Qualified Pipeline | Your ads are creating real sales opportunities |
| Revenue | CAC, ROAS, Cost Efficiency | Your ads are making the company money |
Pay for performance advertising is a payment model where you only pay when a specific action happens. The most common version is pay-per-click (PPC), where you pay Google or LinkedIn every time someone clicks your ad.
Other models include pay-per-lead (PPL) or pay-per-acquisition (PPA). The pitch sounds great: you’re not paying just to show your ad, you’re paying for actual results. But here’s the catch—it’s only as good as the “performance” you’re paying for.
If you’re paying for clicks that never turn into customers, you’re still lighting money on fire. The real goal isn’t to pay for performance. It’s to make sure the performance you’re paying for leads directly to revenue.
Knowing your metrics is step one. Actually doing something about them is where most marketers get stuck. Improving ad performance isn’t a one-time project you can check off. It’s a constant cycle of testing, learning, and adjusting.
There are four main areas you need to get right. Mess up any one of these and your campaigns will fail no matter how much money you throw at them.
You can write the most brilliant ad copy in the world, but if you show it to the wrong people, it will bomb. Audience targeting is the foundation of every successful B2B campaign.
The problem is that most ad platforms have pretty weak targeting for B2B. LinkedIn is decent, but Google and Meta are built for consumer advertising. You need to get hyper-specific about who you’re targeting.
Don’t just target by job title. Target by company size, industry, technologies they use, and whether they’re showing intent to buy a solution like yours. The more precise your audience, the more your message will resonate and the less money you’ll waste on people who will never buy.
Once you know who you’re talking to, you need to figure out what to say. This is where ad content performance comes in. You need to constantly experiment with different headlines, copy, images, and videos.
Don’t just guess what will work. Run structured A/B tests where you change one variable at a time. Test headline A versus headline B with the same image. Run the test long enough to get real results, not just random noise.
Then double down on what works and kill what doesn’t. This process never stops. What worked last quarter might not work today because your audience changes, your competitors change, and the market changes.
Your ad makes a promise. Your landing page has to deliver on it. If someone clicks an ad for “The Definitive Guide to Account-Based Marketing” and lands on your generic homepage, they’re bouncing immediately.
Here’s what your landing page needs:
Nobody wants to fill out a 15-field form just to download an ebook. Ask for name and email. That’s it. You can get the rest later.
How much should you pay for a click or a lead? How much money should you put behind your best campaigns versus your experiments? These aren’t one-time decisions. You need to answer them every single day.
Ad platforms have automated bidding strategies, but they’re optimizing for the platform’s goals (getting you more clicks), not your business goals (getting you more customers). You have to constantly monitor performance and shift budget to the campaigns, audiences, and creative that are actually driving pipeline and revenue.
Google Ads is powerful but also incredibly easy to screw up. Most marketers get lost in the weeds and waste a ton of money on irrelevant clicks. When you analyze your Google Ads performance, you need to look way beyond surface-level numbers.
Start by customizing your columns in the main dashboard. Add columns for conversions, cost per conversion, and conversion rate. These matter infinitely more than clicks and CTR.
Then dig into the Search Terms report. This shows you the exact queries people typed into Google before they saw and clicked your ad. You’ll be shocked at how much money you’re wasting on irrelevant searches.
Someone searching for “free marketing software” is not the same as someone searching for “enterprise marketing automation platform.” Add irrelevant terms as negative keywords so you stop paying for clicks that will never convert.
Finally, pay attention to your Quality Score. This is Google’s rating of how relevant your keywords and ads are. A higher Quality Score means lower costs and better ad positions. It’s one of the most important indicators of campaign health.
If all of this sounds like a lot of work, that’s because it is. Trying to manage ad performance manually is an absolute nightmare. You’re stuck downloading CSVs, wrestling with pivot tables, and trying to stitch together data from a dozen different sources.
Your data lives in Google Ads, LinkedIn Ads, Facebook Ads, your CRM, and your marketing automation platform. Creating a single campaign performance report that shows the full picture from first click to closed deal is basically a full-time job.
And here’s the worst part: by the time you finish your analysis, the data is already old. You’re making decisions based on what happened last week or last month, not what’s happening right now. This manual approach is slow, error-prone, and keeps you stuck in reactive mode.
Most B2B marketers spend 70% of their time on manual execution and reporting. That leaves maybe 30% for actual strategy and creative thinking. No wonder so many marketers are burned out and missing their targets.
The solution isn’t to work harder or hire more people to manage spreadsheets. The solution is to use tracking software that automates the entire process. Performance marketing tracking software connects all your ad platforms, your CRM, and your analytics in one place.
Good tracking software should do three things automatically:
This means you can see in real time which campaigns are generating pipeline and revenue, not just clicks and impressions. You can make decisions based on actual business impact instead of guessing.
The best systems go even further. They don’t just track performance—they automatically optimize it. They can shift budget from underperforming campaigns to winners, pause ads that aren’t working, and test new variations without you lifting a finger.
The goal of B2B marketing isn’t to become a spreadsheet expert. It’s to create demand and generate revenue. But most marketers are so buried in manual work that they have no time left for strategy.
You spend your days pulling reports and tweaking bids instead of thinking about positioning, messaging, and how to reach new markets. You’re stuck reacting to what happened yesterday instead of creating what happens tomorrow.
There’s a better way. Instead of trying to do all this work yourself or building a massive team to manage it, you can automate the entire process. A system that executes thousands of campaign experiments, analyzes results in real time, and automatically shifts budget to what’s working.
That’s exactly what Metadata does. The platform automates campaign execution and optimization across every major paid channel. AI agents work around the clock adjusting budgets, bids, audiences, and creative variations based on what’s actually driving pipeline and revenue.
This means you can finally focus on strategy instead of spreadsheets. You can test bold new ideas without worrying about the manual work. And you can prove exactly how your ad spend connects to revenue.
If you’re tired of the manual grind and ready to see how your ads can directly drive revenue, book a demo at metadata.io/book-a-demo.
Frequently Asked Questions (FAQ)
What is a good ROAS for B2B advertising?
How long should I run an ad before measuring performance?
What's the difference between ad performance and campaign performance?
Should I optimize for clicks or conversions?
How do I track ad performance across multiple platforms?
What is ad performance analytics?
How often should I check my ad performance?