Table of Contents
For demand marketers focused on driving sales and business growth, revenue is the ultimate KPI.
And targeting your audience with paid social media campaigns is one of the best ways to do that.
When you hit the sweet spot of the right audience, right social channel, right ad and right offer, there really isn’t a better advertising medium for B2B.
This B2B Paid Social Benchmark Report will give any B2B company the data, insights, and social media strategies to level up their social media ads.
To find out what’s working, we looked at what’s working for our own customers.
We analyzed actual campaign data from every experiment the Metadata.io platform ran in 2020 to find paid social media benchmarks.
We looked at every data point we have access to, from spend and impressions to clicks and leads to MQLs—then all the way to opportunities and closed deals.
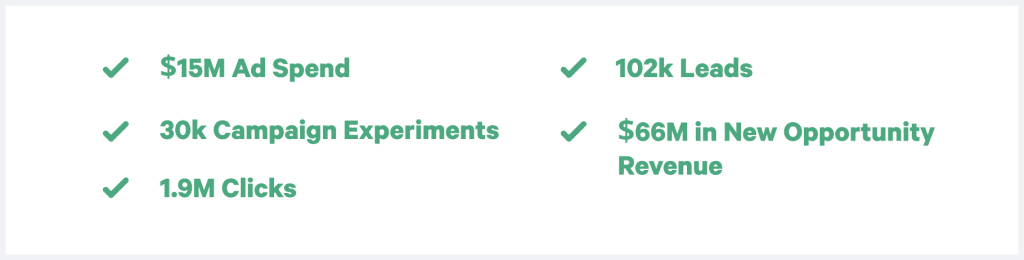
Our customers run the gamut from software to manufacturing to services—each with their own unique demand models. But after analyzing nearly $15M of ad spend, we’ve zeroed in on some of the ways our customers are boosting their LinkedIn and Facebook campaign performance.
The benchmarks and insights in this report are based on straight-up averages across all Metadata customers.
But we’re giving you the raw data so you can slice and dice however you’d like—by industry, annual ad spend and company size.
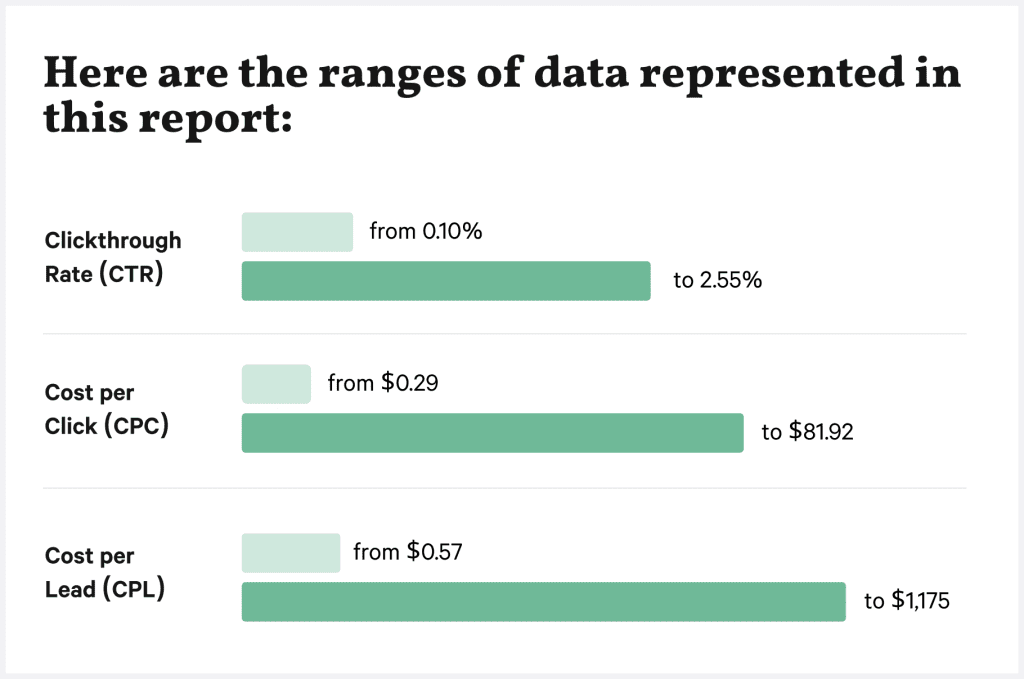
As you can see, there’s a huge range from lowest to highest values across the different metrics. That’s because there’s a wide range of differences in our customers and the products they sell.
For example, an $82 CPC could be great for a company that only targets CEOs of maritime engineering companies with a $100k ACV product, but horrible for a company selling task management software to developers for $12/month.
We already know what you’re thinking: My audience isn’t on Facebook.
But your customers don’t build walls around their professional and personal lives—you have to meet them where they are. With more than 2 billion users worldwide, including 74% in the US who check in daily, Facebook could potentially get a boat-load of high-quality, high-earning eyeballs on your B2B campaigns—if you can target them.
That said, there are differences between running Facebook ads and Linkedin ads that impact your campaign planning.
Although the averages may tilt to one platform, there are definitely positive and efficient use cases across both. It just depends on who you are, who your audience is, and the types of offers you run.
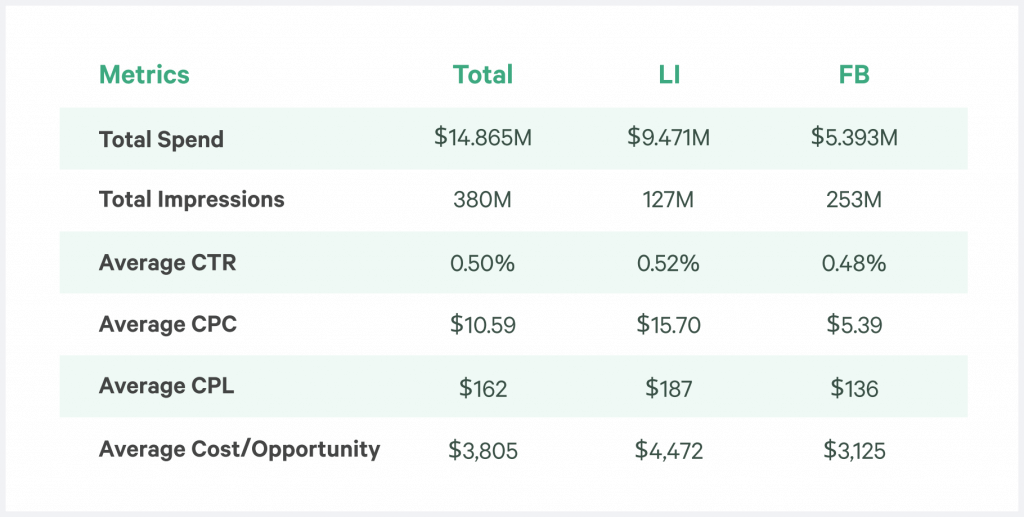
Generally, CPLs are 10-50% lower on Facebook—but not always. Some of our customers actually get lower CPLs on LinkedIn. For example, for some personas and in some countries, Facebook is simply used much less, meaning there’s a larger audience on LinkedIn.
More inventory means lower prices. There are also some offers, like demo requests aimed at a retargeting audience, that can be more efficient on LinkedIn.
When it comes to lead quality we don’t see a big difference between LinkedIn and Facebook. But (shameless plug ahead!) this is primarily because of how we build audiences in these two ad channels using the Metadata platform.
We can use standard firmographic and job title targeting across LinkedIn and Facebook, targeting the same people without using lookalike audiences or personal-interest targeting.
What do you want your audience to do when they see your ad? The answer to this question—your CTA—is one of the most critical parts of any ad. It’s also one of the easiest things to experiment with. You can duplicate an entire campaign and just change the CTA.
So test it early to see which brings the highest CTR or lowest CPC and then use that one going forward.
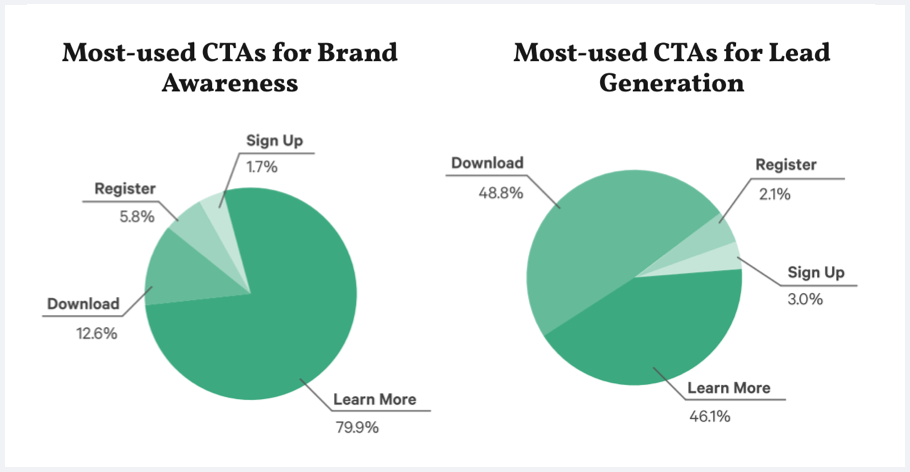
Most-used CTAs for brand awareness
Nearly 80% of our customers used “Learn More” for brand awareness, making it most popular by far. It makes sense since it sounds like the least commitment.
Most-used CTAs for lead generation
46% also used “Learn More” for lead gen—but be careful to set clear expectations. It could feel like “bait and switch” if you make people fill out a form.
These are straight averages across all Metadata customers. The range of CTRs are from 0.10% to 2.55%. The range of CPLs are from $0.57 to $1,175. The range of CPCs are $0.29 to $81.92.
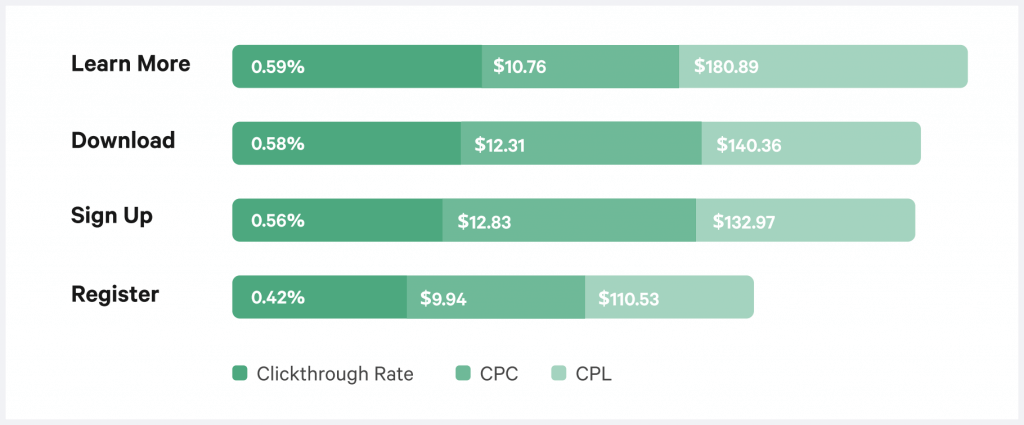
“Learn More” has the highest clickthrough rate on LinkedIn—but also the highest CPL. So if your goal is demand gen, but you optimize only for engagement, you’ll pay a lot more.
“Register” on the other hand, is one of the least used CTAs but also carries the lowest CPL, making it a budget-friendly option for webinars or events where people have to register.
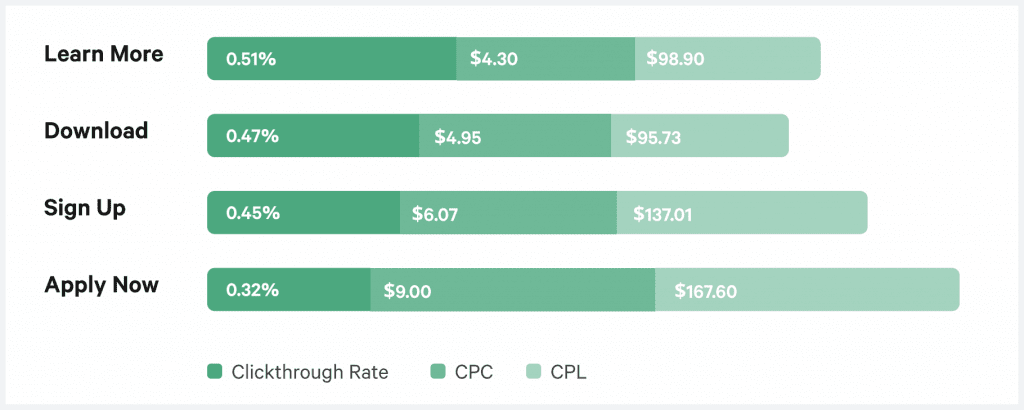
Facebook gives you four CTA options for image and video feed ads: Learn More, Download, Sign-Up, and Apply Now. But Apply Now barely gets used.
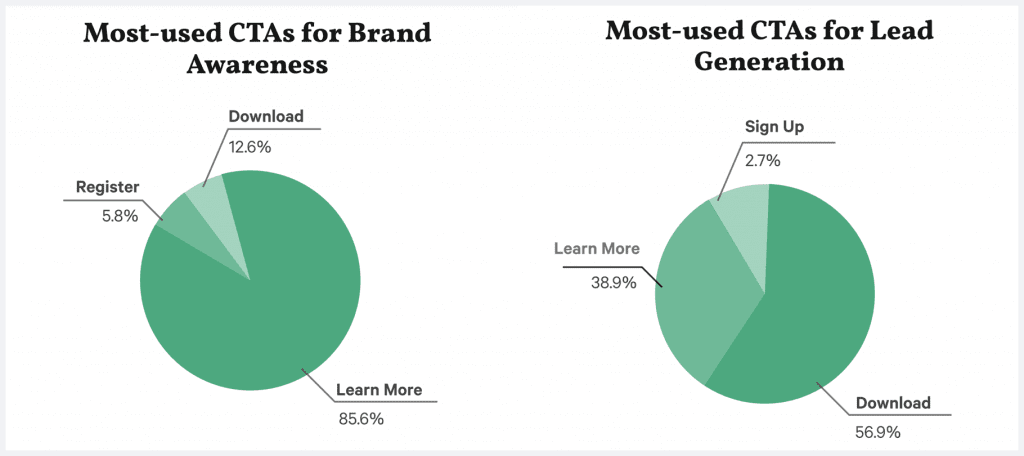
Here’s what we found were the most used CTAs for brand awareness and lead generation:
On Facebook, the most popular CTAs also happen to have the lowest price tag. “Learn More” is most efficient, with the highest CTR and a CPL on-par with “Download.”
It’s interesting how “Learn More” performs differently on Facebook vs. LinkedIn. For example, on Facebook “Learn More” has an average CPL of $98.90, while the same CTA on LinkedIn has a CPL that’s nearly double at $180.89 and is most expensive.
“Apply Now” really only makes sense in special cases—like job postings and association memberships—so it’s not surprising that our customers rarely use it. It also had the highest CPC and CPL and the lowest CTR.
In this category, we saw notable differences between LinkedIn and Facebook.
Why?
Well, for one thing, each platform allows a different maximum number of characters. LinkedIn is 300 while Facebook is 63,206!
Our data shows that longer ads have the best clickthrough on Facebook vs. shorter ads on LinkedIn. Same thing for CPL—longer ads have lower CPL on Facebook.
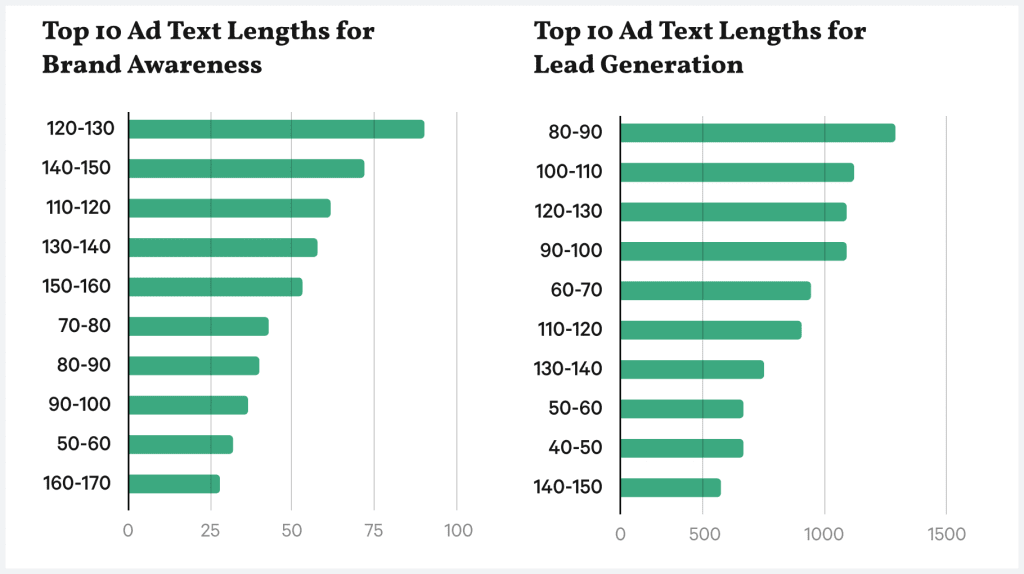
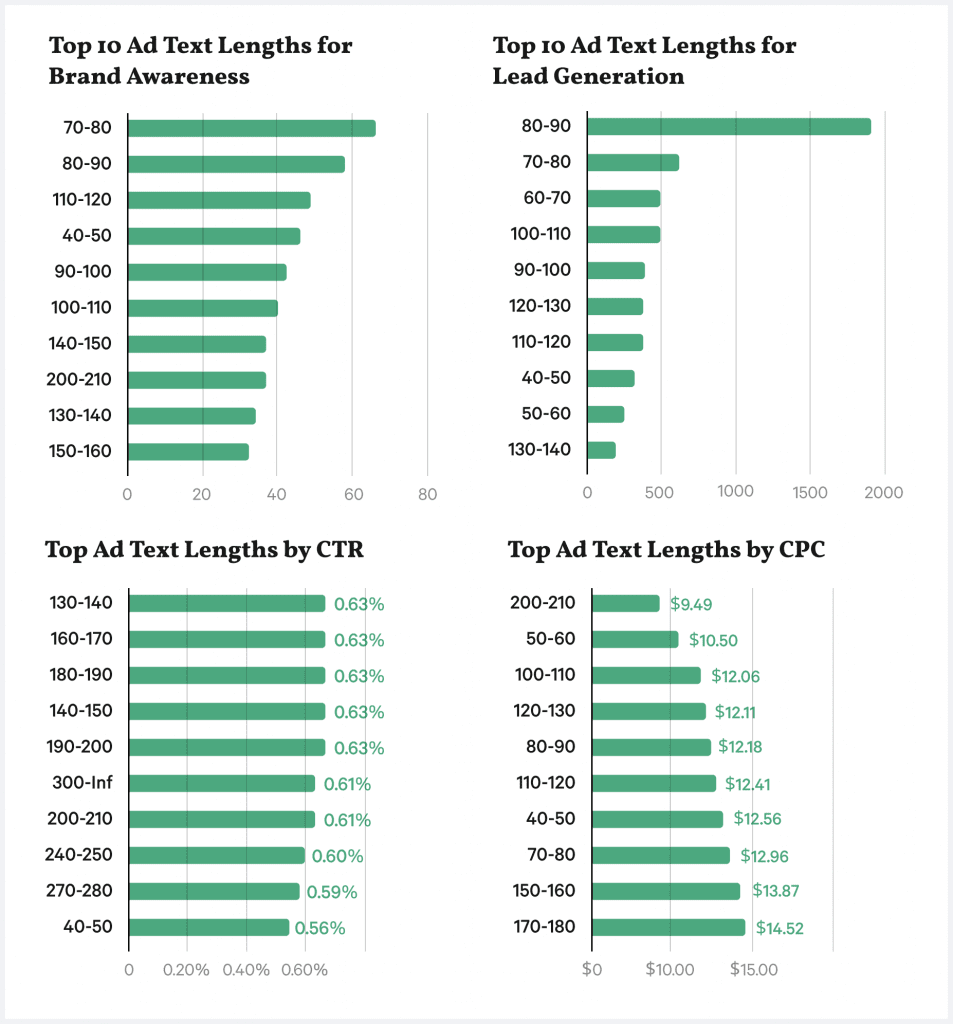
For both brand awareness and lead gen campaigns, you can see that the most common text length tends to be more than 100 characters: 140-150 characters seems to be the sweet spot for brand awareness campaigns.
But that length doesn’t even crack the top-10 lowest CPCs.
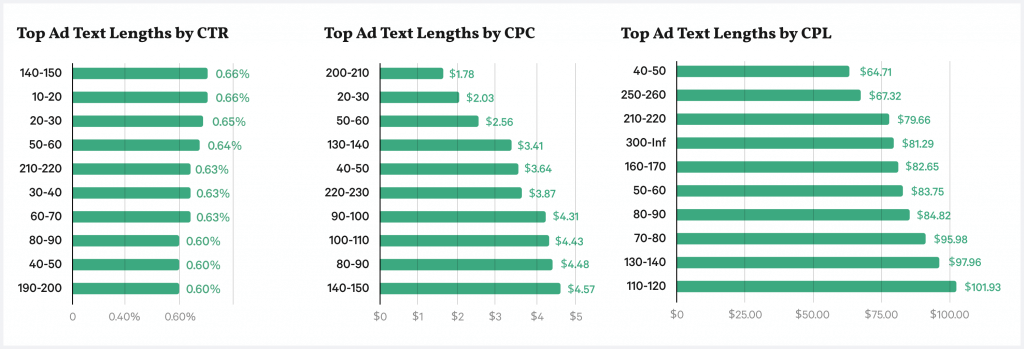
The tendency is to write longer text, but using fewer words generally yields better performance, especially for CPL campaigns.
On Facebook, where people tend to hang out on weekends or in their spare time, longer ads generally more clicks compared to LinkedIn. They also have some of the lowest CPLs.
Here are some real examples of longer ad text in Facebook that each had >1.5% CTR:
Example 1: “In traditional script-based tools, such as Selenium, object selection is typically pretty obtuse. In this white paper, we explore why this is a problem and show how smart object selection increases effective test coverage by an order of magnitude.”
Example 2: “Many businesses are adopting more work-from-home processes, so moving your IT infrastructure may be a “must-do” right now. If you’re looking for an option for your on-premises #IT #infrastructure, move to our #datacenters. Act now for discount offers!”
Example 3: “How do you exceed your demand gen goals for the rest of 2020? Even if you blew away the first quarter, how do you make sure you are thinking next level? In this “ask me anything” format, you’ll have demand gen and marketing technology experts addressing a curated selection of your burning questions about revOps, demand gen and marketing automation strategy.”
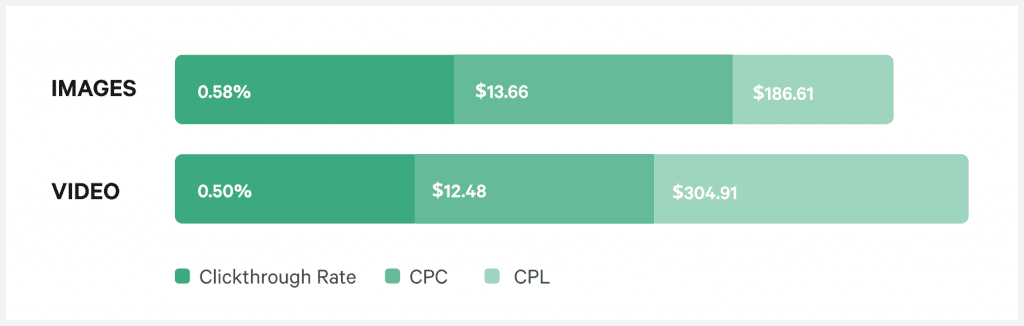
While CPCs for videos are a bit lower than images, by most other metrics images outperform videos for our customers. This is a smaller sample of data, only from LinkedIn, and only from the last 4 months of the year after we started offering video.
Based on the survey we ran at the end of 2020, we know more than 70% of you are planning to use more video in 2021. But videos take a lot more time and money to produce than images. So before going all-in, make sure video is really the best format for the type of content you want to create. Like when you want to showcase your company culture or grab attention right away.
Curious about the ideal video length for paid social campaigns? So are we! And
although we originally planned to include this in our trends analysis, we didn’t have enough data to be statistically significant. That said, 30 seconds should be the absolute max length for any video used in
your campaigns. We typically recommend between 6-15 seconds.
We also looked at which images performed best and found that ads with high clickthrough and low cost per lead had a few things in common:
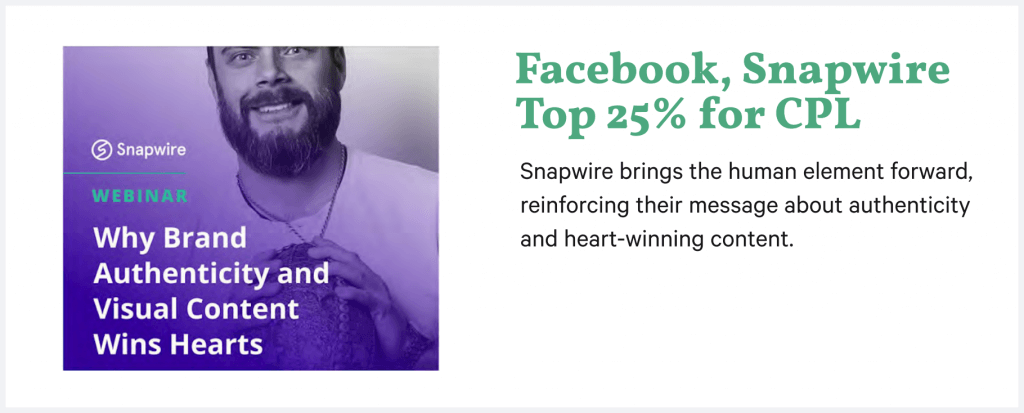
Real people humanize a B2B brand and are a common feature of ads that got the highest CTRs and lowest CPLs, especially on Facebook.
Don’t be afraid to be a name-dropper—people click on images with names they know.
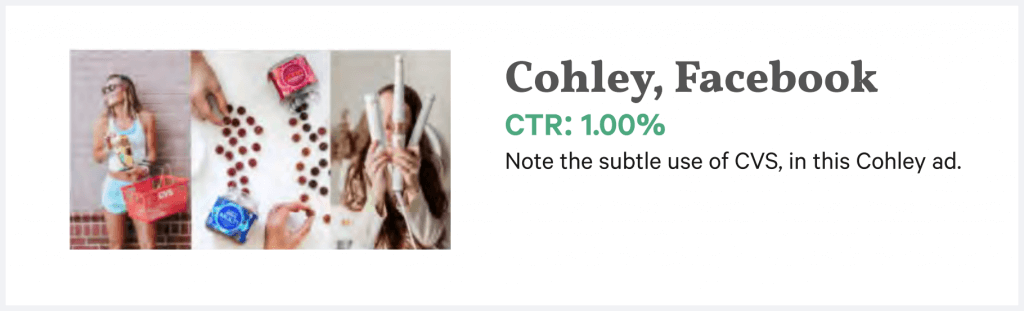
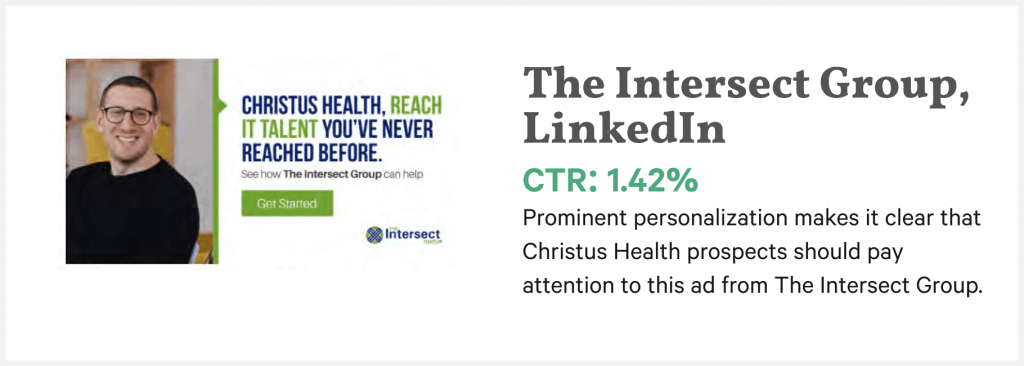
Relevance always wins. Images with the highest CTR on LinkedIn featured names prospects immediately recognize—either their own companies or other well-known brands.
We’ve shared a lot of data here. Like we said up-front, this data looks at averages across all of our customers, but we’re also giving you access to the actual raw data—so you can dig in and pull insights that are most relevant to your business.
It’s interesting to see what’s worked best in the past. Even better is using that data as a starting point for the winning plays we’ll run next.
Based on our customer survey, we know most of you are planning to double down on LinkedIn and video. (We’d start with LinkedIn.)
You’re also looking to personalize your marketing. We hope that means more than just name-dropping your target accounts and bringing in more humor and empathy. Don’t just personalize; make it personal.
We’re all hoping to see more ungated content. This is something we’re betting on ourselves. But be ready to set expectations: your landing page hits and your volume metrics will go down, but deal cycles should move faster. Just make sure you and the “front office” are on the same page.
As we’ve noted before, “what works” is changing faster than ever. The campaign that failed three weeks ago may work today. The evergreen campaign that’s worked for two years could stop working next week.
So as B2B marketers we’re constantly testing, refining, testing some more.
And while the data we shared in this report focuses on top-of-funnel metrics like CTR, CPC and CPL, you also have to look at lower-funnel performance and connect the dots to real ROI: pipeline, closed business, revenue.