Facebook Ads Benchmarks: Optimize Your Facebook Spend
In this data-backed guide, we’ll walk you through the most recent Facebook Ads Benchmark data.
We’ll cover:
- The most popular CTAs on Facebook
- What is a good CTR for Facebook ads?
- The average CPC for Facebook
- What’s a good cost per result on Facebook?
- Build your own Facebook advertising benchmarks
First things first: Facebook ad performance will vary for you depending on several factors. Including product price, industry, revenue, or number of employees.
To maximize your return on ad spend, it’s crucial to understand how your campaigns measure up against industry benchmarks. Key metrics like cost per click (CPC), click-through rates (CTR), conversion rates, and return on ad spend (ROAS) are essential for evaluating performance and identifying optimization opportunities.
All of this data should be directional for you. I’m not telling you that every B2B SaaS company in this industry gets $X CPC or CPL.
But we have an entire dashboard that will let you customize your benchmarks based on industry, revenue, country, and more. We always suggest you take these Facebook paid social benchmarks as a single data point to support a larger story.
Facebook for B2B?
We know, we know: B2B advertising on Facebook? The most common excuse we hear is “I don’t have an audience on Facebook.”
But here’s the thing: they are, you just need to know how to target them. You have to connect with your customers where they are, not where you want them to be.
📚 Read more: How to Find Your Perfect B2B Facebook Target Audience
Facebook has nearly 3 billion users around the globe, including around 140 million daily users in the US. Facebook could get you high-quality, high-earning eyeballs on your B2B campaigns—if you can target them. So, while Facebook is traditionally associated with B2C marketing, its massive user base does provide significant opportunities to reach your target audiences.
Metadata customers spent nearly $13 million on Facebook in 2021, generating 450 million impressions.
Long story, short: with the right audience, offer, and campaign type, Facebook can be a much cheaper way to drive both brand awareness and leads for your B2B company.

Metadata customers ran over 25,000 of Facebook experiments in 2021. We analyzed the data from every one of those experiments so you can make more informed decisions for your own Facebook advertising.
Here’s what it looks like in practice.
What are the most popular CTAs on Facebook?
When you place an ad on Facebook—including image ads, video ads, and text ads—the platform gives you a handful of CTA options. The three most popular Facebook CTAs are:
- Learn More
- Download
- Sign Up
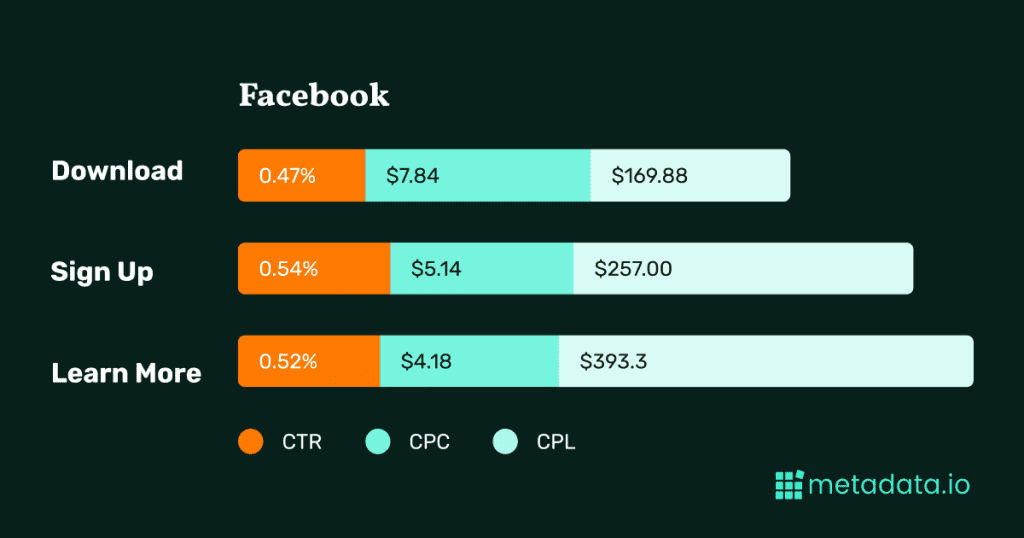
Metadata users overwhelming favor “Learn More” and “Download” as Facebook CTAs, with “Learn More” at the top. Together, these two CTAs make up nearly 85% of the experiments we analyzed from 2021.

Those are the most popular CTAs on Facebook. But what about the most effective?
Like any good marketer, we’ll tell you: it depends.

While “Learn More” was the most popular, it didn’t have the highest CTR of the three—and it saw the highest CPL by a wide margin. Its popularity likely has to do with its relatively low CPC. But we always recommend taking the big picture into account: for example, “Download” might have the highest CPC, but we found that the Facebook CTA also results in the lowest CPL further down the funnel.

What is a good CTR for Facebook ads?
Metadata customers separate their Facebook experiments into two distinct camps: lead generation and brand awareness. Brand awareness ads are optimized for clicks, while lead gen ads can be tracked all the way through to closed-won revenue.
Across both types of campaigns, the average CTR on Facebook in 2024 was 0.77%.
That said, Facebook advertisers saw a fairly large range in CTRs: from 0.10% on the lower end to 2.80% on the high end.
Side note: this is exactly why we recommend that you use these benchmarks as a starting point, then set your own benchmarks as you invest in Facebook ads. A 0.77% CTR on Facebook is a good KPI to start with, but your own success metrics will vary based on your offer, your creative, and your audience size and demographics.
(More on setting up your own benchmarks at the bottom of this article—along with the full data set for Facebook advertising KPIs!)

Facebook Ads CPC: What is a good CPC on Facebook?
While CPC isn’t the end-all-be-all of your Facebook advertising KPIs, it’s a good leading indicator of how effective your campaigns are. You don’t want to overpay for clicks, only to find that visitors aren’t converting further down the funnel.
Across all campaign and offer types, Facebook advertisers saw an average $5.68 CPC last year.
That’s well below LinkedIn benchmarks, making Facebook a cost-effective channel for B2B brands—especially for brand awareness campaigns.
While we wish we could tell you what a good CPC on Facebook looks like, the range of factors is just too large. We’ve seen it go as low as $2 and as high as $10. Instead, we recommend using this average as a benchmark to start, then experimenting your way to determine what an ideal CPC for each campaign is on your end.
(Remember: your CTA can impact your Facebook CPC quite a bit. “Learn More” is on the lower end, while “Download” is on the higher end.)
Maintaining costs around this benchmark suggests your targeting and ad relevance are on track.
What’s a good CPM for Facebook?
The average CPM for the Facebook campaigns we tracked was $30.
Again, what you define as “good” will depend on your offer, campaign type, audience, and more. Take a look through the data below (and our walk-through video) to start setting your own benchmarks.
What’s a good cost per result on Facebook?
Again, we’re going to say: it depends on your goal and definition of “result.”
Are we talking conversions? Leads? Closed-won revenue?
Take a look at these Facebook metrics to start:
- Average Cost Per Impression: $0.03
- Average Cost Per Click: $2.52
- Average CPL: $146.14
- Average Cost Per Opportunity: $5,292
While higher than B2C benchmarks, B2B leads typically have greater potential value and longer sales cycles, which justifies the investment.
Optimizing Your Facebook Ad Performance
In B2B Facebook advertising, small optimizations can lead to significant performance improvements. Based on our analysis of over $42M in ad spend, here are strategies to maximize your campaign effectiveness.
Ad Copy Optimization
Contrary to common advice about keeping social media copy brief, longer ad text performs better for B2B audiences. Ads with more than 150 words consistently show higher click-through rates and lower cost per click compared to shorter variations. For headlines, aim for 40-60 characters for optimal engagement.
Visual and CTA Elements
While video content dominates social media, image ads outperform video in lead conversion rates and cost per lead in B2B contexts. Focus on creating high-quality images that:
- Feature real people
- Incorporate relevant statistics
- Drive curiosity through visual storytelling
Targeting and Bidding Strategy
Automated bidding strategies outperform manual bidding, delivering better downstream metrics like cost per lead and cost per opportunity.
For maximum impact, combine these optimizations with regular A/B testing. Track performance against key benchmarks to ensure your campaigns perform above industry standards.
Build your own Facebook advertising benchmarks
While industry benchmarks provide useful reference points, you should also establish custom benchmarks for even more meaningful performance measurement.
Your business context significantly impacts what “good performance” looks like for your Facebook campaigns.
Consider these factors:
- Your product’s price point and sales cycle length
- Your company’s revenue model and growth stage
- Your target audience size and characteristics
- Your campaign objectives
- Your industry’s typical conversion patterns
Collect baseline data for at least 3-6 months, tracking both standard metrics and revenue-focused KPIs. While the average Cost Per Opportunity in B2B Facebook advertising is $5,292, your target should reflect your specific unit economics.
Focus your benchmark tracking on metrics tied to revenue:
- Pipeline generated from Facebook campaigns
- Cost per qualified opportunity
- Deal closure rates from Facebook-sourced leads
- Customer acquisition costs by campaign type
- Return on ad spend across different audience segments
Benchmarks should evolve as your business grows and market conditions change. Regularly review and adjust your targets to ensure alignment with your company’s growth goals.
Maximizing ROI Through Benchmark Analysis
Successful B2B Facebook advertising hinges on your ability to measure, analyze, and optimize against industry benchmarks. With average CPCs at $2.52 and expected conversion rates between 2-5%, continuously monitor your performance to identify optimization opportunities. Focus on down-funnel metrics that directly impact your business, like pipeline value and customer acquisition costs.
The campaign that worked last week may not work today. The campaign that’s been working for two years may stop working next week.
When it comes to demand gen marketing, we’re always in testing mode. We’re constantly refining our approach and testing new ideas.
By leveraging automation platforms like Metadata.io, you can scale optimization efforts while maintaining a focus on achieving a crucial 4:1 return on ad spend.
Establish your baseline metrics, implement a regular optimization schedule, and use these benchmarks to guide your Facebook advertising strategy toward measurable business outcomes.
Your data is only as good as what you do with it.
Want more data on B2B advertising?
Check out our B2B Paid Social Benchmarks report. It includes this breakdown of CTAs, along with ad creative and copy best practices across Facebook and LinkedIn.


